Value Investing: An Untold Truth

My latest article on …
Value Investing: An Untold Truth
It is the most common Investment style amongst amateur market players. However, it is not as safe and or as simple as it has been made out to be. Read on so that you don’t become a long-term victim of this most misunderstood style of investing.
Article is here: https://www.financialscents.com/value-investing-untold-truth/
Online Trading: The Obvious Lie

This is a three-part article on “Online Trading: The Obvious Lie” which was originally posted at www.financialscents.com.
The market is a pipe-dream to many and an office to others. What’s real and why do some make it while others wipe out?
Part 1: Online Trading: The Obvious Lie – Part 1
The second instalment asks why we spend money and take so much effort to learn what is safe when it is not the safe stuff that kills our trade or investment?
Part 2: Online Trading: The Obvious Lie – Part 2
In the final instalment, we’re going to get a greater understanding of what it means to think, analyse and work as a Global Macro Trader or Macrotrader.
Part 3: Online Trading: The Obvious Lie – Part 3
If you’re trading and getting no joy, you should read this … and get real.
~~~~~~~~~~~~~~~~~~~~~

Merry Christmas 2018!

Selamat Hari Raya 2018

WEEKEND MOTIVATIONAL MESSAGE – Saturday 31 March 2018

GIVE
(Read before you watch the video – Link at the end)
This three-minute Academy Award winner for Best Animated Movie is not just about a great piece of entertainment. It has so many deeper lying messages but one clear lesson …
It is all too easy to judge and be selfish when we don’t have the bigger picture. We then justify our judgements with our own selfish reasons.
But if we just took a little effort to look deeper, the bigger picture is always going to make the short-sighted judge look and feel like a fool … a selfish fool.
I’ve learnt to be less judgemental since I took on the role of teaching. My students come from all walks of life with various needs and varying objectives. Some come to class dressed like scallywags but are actually pilots, doctors and high-networth individuals. Others come dressed to impress but are in reality, fighting to stay financially afloat.
Some learn quickly but can’t apply as quickly while others take a longer time to learn but eventually become more efficient and proficient than the fast learners.
Then you will get those who struggle and struggle that you’d quickly deem as “stupid” or “slow” when in fact, they’re not … they simply conceptualise things differently, process things differently or even get bogged down with something I didn’t consider – they are not technically savvy so they struggle with their computers and nothing else.
It is for this reason that I’ve become less judgmental and live life from a different perspective today – I GIVE;
- Give a damn
- Give a chance
- Give it a go
- Give way
- Give in
- Give it thought
- Give it some time
- Give the benefit of doubt
- Give some sympathy
- Give without expectations
- ForGive
In short, just do GOOD DEEDS instead of judging. Regardless of what an asshole the other person might seem to be, without knowing their side of the story, don’t judge … GIVE … and you can keep it simple by just doing a good deed of not judging.
Have a lovely weekend. Forgive, Give and be Happy that you’re not a judgemental asshole. You’ll find life more beautiful when you do.
Enjoy the video. Share it with your kids and teach them something good today.
Happy Easter, Everyone!!
Happy Lunar New Year 2018!

WEEKEND MOTIVATIONAL MESSAGE – 19 January 2018
Failing at anything is a common occurrence. Small failures like burning the dinner, not screwing the lightbulb properly, etc, happen from time to time. We think nothing of it and life goes on after we rectify the situation.
So why do we allow the larger failures to kill our motivation, end our dreams and halt our direction in life? Why don’t we address the problem, overcome it and carry on with life?
The answer is often because we prefer to live in denial, blame something or someone else for it and spend too much time and effort complaining about it needlessly. All of which is not productive and only serves to extend the status quo … or worsen it.
Take accountability and be responsible for it. Whether or not it was your fault or circumstantial, the fact remains – you have a problem. FIX IT and fix it quickly. If it can’t be fixed, cut your losses quickly, get over it and start again.
You started something because you were motivated to do so. Find that motivation again. Discover the hunger once more. Know your “Why” and restart again.
Failure is only complete when you quit, give up or walk away.
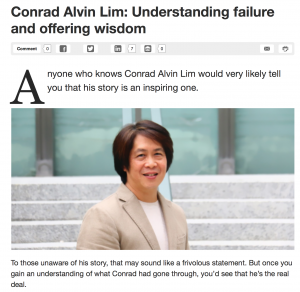
Many are familiar with my story of failure and recovery. But few actually know the pains and struggles that went into that journey. As painful as it was, it had to be done.
It is a very tired story that still motivates many people today. 18 years after it started and 11 years after it ended, it still engages and inspires a lot of people.
I am flattered. I didn’t deliberately set out to make that happen. I never intended for it to be like that. I don’t think anyone would wish it upon themselves.
But everything happens for a reason. Thus, if this is my calling, then I will serve to motivate and inspire as long as the public calls for it.
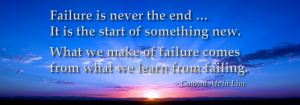
Failure is never the end. I have always seen failure as the perfect reason to start something new and promising.
I hope you enjoy the article below. It was a very lengthy interview for a think tank. It will be followed up by an empowering session sometime after CNY. I hope to serve you then.
Have a truly empowered weekend ahead! Happy Hunting!
Happy New Year!!

How To Avoid Getting “Scammed”?
 To be fair, not all scams started with the intention to scam. Its just that the business model was not properly thought through and it ended up looking like a scam.
 Did you read the prospectus thoroughly?
But it was certified and sanctioned …
Smart Expo 2017