Lunar New Year 2017

As the new lunar year draws upon us, take the time to mull over how you’re going to make the Year Of The Rooster a better year than last year in spite of the difficulties and hurdles that lay before us.
• If you never give up, you don’t fail.
• You may falter but you can get up.
• They can beat you down but you can fight back.
• Many will discourage you but you can do better.
• For everything that happens, there will be an outcome you can control.
There is always one more thing you can do to make your year a better one. There is always something to be thankful for. There will always be something worth fighting for. There is every reason to want to be better than the person you were last year.
Have a safe and great weekend everyone!!
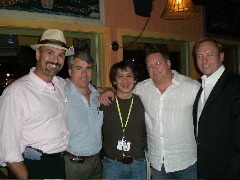
The End Of My Ten-Years At AKLTG (Adam Khoo Learning Technologies Group)
All good things come to an end and my 10-year association to AKLTG (Adam Khoo Learning Technologies Group) is no different as both AK and myself have outgrown each other over these amazing years together as the leading financial educators in the business. I am proud to have been associated with them and will forever be grateful for the opportunities that helped me achieve my dream of teaching and changing peoples lives. Now it is time for me to move on to pursue bigger challenges.
With effect from 24 November 2016, The Pattern Trader Tutorial sounded its intentions to leave AKLTG as its client and AKLTG has agreed to our separation. They will no longer be Pattern Trader’s exclusive marketing agent and/or exclusive event manager after 30 June 2017. (But that is not to say that we won’t be collaborating on ad-hoc projects in future.) So between now and 30 June 2017, AKLTG will still continue to market and manage the final few batches between now and June 2017 as part of the closing transition;
- PTT88 (SG Weekly) – January 10, 2017
- Candlestick/Breakout WS (SG) – February 25, 2017
- Post-Graduate Tutelage (SG) – March 13, 2017
- Commodities & Futures (SG) – March 10, 2017
- Candlestick/Breakout WS (MY) – March 26, 2017
- PTT89 (SG Weekend) – April 21, 2017
- PTTMY35 (MY Weekend) – May 05, 2017
The Pattern Trader Tutorial will continue running on its own after June 2017 under a new entity as we evolve into the next phase of growth. The intention is to make the Pattern Trader Tutorial better and more exclusive with a more efficient syllabus, more complete content, state-of-the-art tools and massive digital support in the usual small-class environment, albeit with more bells and whistles. It will be the best learning experience for anyone who wants/needs the complete and holistic approach to understanding finance and economics with the most efficient and comprehensive tool kit for applying their skills in the most cut-throat business in the world.
All past graduates will continue to be supported by me and will still be considered my graduates as we move into the next phase. I intend to make this transition seamless so that they won’t have to worry about disruptions to our on-going and support programs.
I wish to thank each and every Coach/Jnr Trainer, past and present, that has helped me take the Tutorial to where it is today. We may have had our rough times but your contributions are never forgotten as testified by the credits in the ever-expanding training textbook that is in its 9th Edition today. To Lawrence, Henry, Alicia, Gary, Wai Seng, Soon Chung, “Duke” Alvin, Ruben, Pierre, Tok Tong, Woei Tang, Thomas, Dave, Yi Chuan, Sam, Chen Pang, Pei Fen, Soon Ghee, Irene, Jing Ting, Ethan, Paul, Jason, Roy, Diana, Leon, Jay, Ivan, Marc, Alvin, Aloysius, Alex, Adeline and Brian, your contributions and sacrifices will always be treasured and valued. Thank you.
To the many other volunteer coaches who came back selflessly to help out the newbies, to the many TSOs and operational and marketing staff, my deepest thanks for making it happen. Special mentions to Andrew, Queenie, Angie, Terrence, Wandy, Joey, Carol, Daniel, Annie, Pearlyn, Aaron, Ser Yew, Shi Jun, Shidiq, Shermin, Huiwen, Jeri, Caroline, Desmond, Lawrence and Joey.
To all my graduates and everyone who has passed through our doors, to all the students who are still working hard at mastering your craft, my sincerest appreciation for having faith in taking the journey with me. Thank you so much for taking that leap of faith and I hope I have not let you down. I would not be where I am if not for your constant support and encouragement. I am because of you.
If I have forgotten or missed out anyone, forgive me. Ten years is a lot to remember.
Finally, thanks to Patrick and Adam for sticking with me and putting up with my tantrums all these years. My prayers and blessings go with you on your ventures and may you have many more successful years ahead. Thanks for everything and thanks for being there when I needed it.
So now the future beckons as I finish up my final five-and-a-half months at AKLTG. It’s business as usual with many more lives to change. There is so much to be done and a mountain of work to chase. At the end of it, it is a challenge I yearn for and look forward to as I take my journey into the next chapter of my life.
To myself, I say, Happy Hunting!!
Merry Christmas 2015

What Have We Become?
Some time back, I made a posting on Facebook after the Liverpool vs Manchester United match and had a string of other comments that followed. Even my Mom got in on the action.
Followers of my postings on Facebook would have noticed that my Mom and I are rather tight and that we share a love for cooking, good food, humour and a host of other things including our foremost love for God.
This prompted several people to write me asking how come my family is so closely knitted from my Mom to me and me to my kids. My answer was;
Why is yours not?
I found it disconcerting that so many would ask such a thing when it should be the norm. To me, it was like asking, “Why did you slow to stop when the traffic light turned amber?”
Have we, as a society, become so dysfunctional that what is supposed to be normal is not normal anymore?
I believe we have. When once we were courteous and giving, today we are rude and selfish. When once we were conscientious and caring, today we really don’t give a f**k unless we have something to gain by it.
What have we become?
More importantly, WHY have we become like this?
Family values have eroded, no, they have totally lost their way. Respect for your elders no longer exists. Children used to be seen and not heard but now they make themselves heard more than their parents and use it as a weapon to gain what they want. Siblings who loved and cared for their parents in the past now have become bitter and vengeful rivals for their dying parents’ legacies.
Is it about the money? Did society breed all this hate in us? Did the nation’s growing wealth make us greedy and selfish? Has the government failed in raising its citizens right? Have we become so spoilt that its normal for Maria to haul boy-boy’s military full pack? Did we become so ignorant that we blindly trust our government to take care of us when we’re overspending on things we don’t need? Have we become so naive that face and pride precedes common sense?
Are we doing the right things because its the right thing to do?
Or have we mistaken what is actually wrong for normal?
As much as most of you would like to point a finger and blame rather than accept your own failure, the answer is not in the past or what could have been.
It about what we do now to shape the future.
I was raised on old-fashioned family values and I have raised my kids the same way;
- Little children should be seen and not heard
- In an adult conversation, children should only speak when spoken to
- Respect your elders
- I was raised to have good manners – “Please”, “Thank you”, Excuse me”, “No, thank you”, “May I … please”, etc.
- Think of and put others before yourself
- Make Home a special place where children will always feel safe and wanted (Their room should never be a place of punishment)
As they become teenagers;
- Be their best friend
- Groom them in social etiquette and behaviour
- Take an interest in their school matters, hobbies and pastimes
- Spend quality time as a family
- Teach them humility, frugality and graciousness
- Show them proper financial management
- Make Home a place where they are always welcome and loved (The house should not be a place of dread and remorse)
As they become young adults;
- Respect their goals and wishes
- Support and path them properly
- Make them responsible for their choices
- Let them take hard knocks but be there to catch them when they fall
- Allow them their freedom and prepare to let them go
- Leave a door open in case they need to come Home
Communication is key to healthy relationships. This is even more so in a family. Most grievances within a family can be attributed to a lack of communication and a lack of understanding. Family time is the best time to communicate. Mealtimes like lunch and dinner, whenever possible, should be done together at a proper dining setting (not in front of the TV). The table should be filled with conversations (not mobile coms and tablets). Conversations should be about the children’s interests and adult’s advice (not complaints, grumbles and quarrels). Everyone should have a chance to speak and everyone should listen to whomever is speaking (this is mutual respect). Such occasions always bring the family closer.
Have a fear for God in whatever name you call Him – this is called having a conscience. If you are not religious, then believe that there is always a greater force, a higher authority that will rule and judge us. It is imperative that the family is raised knowing the difference between good and bad. The parents must lead by example. Thus, if you’re going to be a parent or if you are already a parent and you have been shithed without realising it, don’t be surprised when your kids start behaving like you. If you ever ask, “what’s wrong with my kids?” or “why do my kids behave like that?”, all you have to do is look in the mirror for your answer. If you’re going to blame your spouse for that, look in the mirror again. Then get your spouse to do the same.
What goes around, comes around. This also means that if you raise your kids as spoilt, disrespectful and rude brats, you are going to be the biggest victim of what you sowed. These shitty kids will grow up and could care less about their parents (because that’s how they were raised). This is why so many young adults these days see their parents as burdens. Remember that if you expect your kids owe you a living, what are you doing for them today to build that credit?
Respect is earned, never an entitlement and certainly not a given. As parents, you earn the respect of your children by respecting them. By spoiling your child and allowing them to wail for whatever they want is disrespectful to you. When you give in to their demands, you are not earning their respect – you are just goading their greed. When they eventually learn that you can be taken advantage of, they will forever disrespect you because you don’t even have respect for yourself by giving in to someone else’s demands. Let the child know who’s boss. This starts at a very young age. Once they know you’re the boss, they will seek protection, comfort and love from you because you have earned their respect. They will trust you. They will seek your counsel. They will love you unconditionally. However, this does not mean to rule by fear. Fear breeds hate. And hate breeds separation. The child must know that behind every tough decision is a reason of love.
It may seem archaic and middle ages. Sometimes other kids think that my kids are uncool. But then, it did raise the question of how come my family is so tight. The fact that people of all ages are asking the same question proves that being a tight family is cool and having family values rock. Even my children’s peers are saying that my kids have a cool family.
The lamest excuse any parent can have for not doing these things is that they have no time. But there’s always time for the iPad and smartphones. I see that all the time – families out having dinner and everyone is on some electronic device instead of sharing a conversation and enjoying quality family time. Some parents even go to the extent of distracting the little one with the iPad so that they are not bothered by the child’s whims or cries for attention.
It all starts when they are old enough to see. That’s right. From the moment the child opens its eyes, they see and learn. Parents set the way the child will grow and learn. Thus the way your child behaves is a direct reflection of who you are as a parent. The sad fact is that such parents won’t take responsibility for the way their child has become and blame everything and anything else under the sun for their ill fortune for having such an ill mannered and badly behaved child.
Raise your child properly. You can be the biggest recipient of their upbringing or the biggest loser when karma comes knocking.

Its You … Not Your Degree That Matters
(Originally posted on my Facebook Page)

Click the pic for the full original article
I don’t totally agree with the headline but the overall piece is good. Your degree may be a useless bit of paper but the education is something you will need unless you picked a major that is not relevant to your passion.
Your upbringing will be your next qualification as it will determine your attitude (rather than a qualified aptitude) in getting that first job. Your personality will be the next qualification (especially in finance) because making money is not the only requirement – financial management is the determining factor because your financial habits will dictate the kind of salary you are demanding and employers would rather employ someone who is prudent rather than lavish.
Then come your mannerisms, sociability, etiquette and humility. You can argue the points all you want but I am proof that such qualities do get you jobs rather than your qualifications – I am a dropout – because I got hefty paycheques as an employee and as a employer, these were the kinds of qualities I picked over qualifications. I have done it all and seen it all from the other side and my graduate peers were always curious as to why they lost out to a dropout.
Many SG Uni grads may feel that it was a waste of time and money only because they took the MOE route which is really lengthy and costly. Most do so probably for the prestige, others because of influence and for some the higher possibility of getting a government based job only to lose out to those who took a more efficient route via off-shore universities that can cost much less. Some of these local grads also have a strong sense of entitlement that make employers pass them over for the graduate that was exposed to foreign challenges under humbling circumstances.
This will forever be an endless argument between those who do and those who don’t but the results at the end of the day are very clear – its the local grads that are unhappier and more demanding whereas grads from off-shore universities tend to be more satisfied and gainfully employed in the private sector as their wage demands are easier and more realistic to meet.
I particularly like the end of the article – It is ok to fail.
This is something most SG grads have a hard time accepting. Private grads don’t have this problem because they have failed which is why they ended up in private universities in the first place!
Happy Lunar New Year 2015

Choose – It Makes You

The Purpose
Got an email from a past graduate who found life becoming mundane and was afraid of becoming just another working “zombie” like those she sees on the train going to work everyday. She asked me what her life meant and how could she make her life more meaningful and fulfilling.
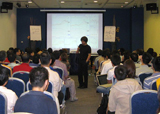
At last night’s class, I told the class that life is nothing more than the game of knowledge and information. He who knows more and is armed with more information holds advantage and dominion over those who lack the knowledge. This is the power game that is played everyday in business, within corporations, at your office, at home, amongst friends and almost everywhere else you can think of. It is even in the market – the power-players always know more than the retailers.
I may not have the answer to the meaning of life but I do believe that the purpose of life is to continue to educate ourselves and to keep ourselves informed.
I have found new purpose in life by arming myself with information and knowledge. It has made me successful, it has made my life meaningful as I educate others to improve their lot in life and it has made me a role model for my children to emulate as they pursue higher learning.
It has made me the top in my profession as my competitors scramble to find an edge to beat me without realising that it is all about continued learning and improving what you already know. While they busy themselves finding ways to beat me, they join the many in that rat race while I go about learning and improving myself, not caring about what they do. I only concern myself about my continued learning because it is that knowledge that keeps me on top.
Change the way you think. Look for a new focus. If you’re a parent, then you have an obligation to raise your children right. Start by gaining knowledge that you can impart to them in the future. Adopt a skill that they can learn from you for their survival and growth. Do something meaningful for yourself so that they can emulate – continue your learning and education.
And always remember that is not about what you want but more importantly about what you NEED that matters more.
At the very least, you won’t be a zombie on the train because you have a purpose while they don’t.
In closing, let me quote Miyamoto Musashi from the final chapter of his “Book Of Five Rings“;
“I will describe the essence of the Ni To Ichi Way of strategy in this book of the Void. What I call the void is where nothing exists. It is about things outside man’s knowledge. Of course the void does not exist. By knowing what exist, you can know that which does not exist. That is the void.
People in this world look at things mistakenly, and think that what they do not understand must be the void. This is not the true void. It is confusion.
In the Way of strategy, also, those who study as warriors may think that whatever they cannot understand in their craft is the void. Someone like that will continue to be distracted by irrelevant things. This is not the true void.
To attain the Way of strategy as a warrior you must study fully other martial arts and not deviate even a little from the Way of the warrior. With your spirit settled on your duty, you must practice day by day, and hour by hour. Polish the twofold spirit of Shin [heart] and I [will], and sharpen the twofold gaze of ken [perception] and kan [intuition]. When your spirit is not in the least confused, when the clouds of bewilderment are cleared away, there is the true void.
Until you realize the true Way, whether in Buddhism or in worldly laws, you may think that your own way is the one correct and in order. However, if we look at things objectively, in the light of the Straight Way of the Heart or in accordance with the Great Square of the World, we see various doctrines departing from the true Way. What you believe in often proves to be contrary to the true way, distorted as it is by tendencies to favor your own thoughts and views. Know this well and act with forthrightness as the foundation and keep the true Heart as the Way. Enact strategy broadly, correctly and openly.
Then you will come to see things in an all-encompassing sense and, taking the void as the Way, you will see the Way as void.
In the void is virtue, and no evil. Wisdom exists, principle exists, the way exists. Spirit is Void.”
Teruro Magonojo
SHINMEN MUSASHI
Appreciation
The best testimonials are the ones from those who have benefited from your contributions to them over the years. It is always very gratifying to hear that my students have grown, improved and become better over the years since they came to the Tutorial. I live to change people’s lives through what I teach and share with those who want to make a difference in their lives.


And it is exceptional gratifying to know that they are making money from the things I have taught them;


Within the span of half a day, two of my senior graduates made postings in Facebook regarding their various experiences as a result of the Pattern Trader Tutorial (PTT).
Leonard, from Malaysia who was formerly working in Singapore with a finance based institution, made this posting based on the lessons he took from his Trader’s Journey.

Ariane attended PTT almost 4 years ago …

… and was so convinced that she got her reluctant son, Brian, to attend within a year later.

Brian today, is one of my brighter sparks.
After I made this post, Jimmy, a graduate from early 2008 made this posting …

… and Irene, a former cabin crew and mother of three wrote this …


And Irene’s husband attended the tutorial about a year after Irene …

~~~~~~~~~~~~~~~~~~~~~~~~~~~~~~
BECOME A MACROTRADER NOW!
Between Ariane, Jimmy, Irene, Leonard and Brian, who says age matters?
When you learn to trade, you will be focused on not losing money rather than focusing on that one lucky big win. You will be trading for a steady income. You will learn to be in control of the trade rather than to be under the control of a trading system. You will be trading in a style that suits your life, needs and wants. You will learn a skill that is sought after by financial institutions as many of my successful graduates are now working with such institutions as proprietary traders, advisors, account managers and portfolio managers.
The Pattern Trader Tutorial has transformed many lives in the last 8+ years. It has given the graduates a new outlook on finance and economics. Those who assumed that the Tutorial was “just another trading course” have been surprised at how much more value the education has been. It has stood them in good stead in their lives, their personal finances, their jobs, businesses, investments and trades.
The Tutorial arms you with the financial knowledge and knowhow necessary to fight and win in any aspect of today’s economy. It makes you savvier about your money. You’ll be smarter about running your business by knowing the state of the economy. You’ll be wiser about your next property investment. You’ll find out that you don’t need to trade on-line to make money – there are other safer ways to make your money work smarter without the risk of taking on an on-line trade.
If you’re sick and tired of attending workshops that don’t work, then attend a tutorial that will change your life. Check out the blogs of some of my graduates years after they attended WAT.
That’s just the tip of the iceberg.
Meet many more on my Facebook account; https://www.facebook.com/conradalvinlim
Cheers!
___________________________________________
Spammers: Take your spams elsewhere. If you haven’t learnt by now, you’re only wasting your time spamming here.
My Life, My Trades & My Bowl Of Salad
I love to cook. I love preparing food for my family to eat. And my family loves eating what I cook for them.
But there’s more to just cooking than meets the eye. Today, when it is so convenient to order in or “ta pau” or just eat out, why, in my busy schedule do I still persist to cook at least seven meals a week for my family?
It is my form of therapy. It serves as a means to calm me and slow me down from the fast-paced nature of the market and the hectic schedules that my life presents. Most importantly, it reminds me that this is Life – this is what Real Life is all about and everything we do is about this.
THE PERCEPTION
This bowl of salad represents the end product.

This is what we see served to us when we eat out. We dig into it without considering anything else except for how it looks, tastes and fills us. Some of us will be concerned about its freshness, crunchiness and its calorie levels. Others will be considering the value-for-money factor. After finishing every last morsel of the salad, we move on to idle chit-chat or slam our faces in our mobile coms while someone else clears up the mess.
For most, this is life … their life – meaningless, routine and superficial. For them, instant gratification is normal. It is a way of life and thus becomes an expected given. As long as they can afford it, these expectations must be met. They care little for cause and consequence because this is what affluence is all about. This type of life breeds sloth, gluttony and pride.
This sort of existence always leads one to chase dreams that are unrealistic and unachievable. It inevitably makes one pursue the wrong things that almost always never delivers on its promise. It makes victims out of the naive, gullible and ignorant dreamers who will insist on living in denial and will never own up to their flaws even when hit with failure. Instead, they will look for the next best thing with the next best promise of instant gratification.
I should know – I was guilty of it. Then bankruptcy hit me and woke me up.
Let’s get back to that salad and let me show you what went into making it …
I found a packet of greens that I bought a little less than a week ago. Some of the greens were soggy and spoilt but there were bits that were still fresh and crunchy. I had to sort them out.

It took 20 minutes to clean and sort out the rotting greens from the good greens. On the right, you can see how much of it I cleared out. On the left, more than half the pack was still in good shape. In the sink, you can see from the colour of the water (compare the colour of the steel surrounding the water-filled basin) how much work went into sorting them out.
Wouldn’t it have been easier to toss out the whole bag and buy a fresh lot instead?
Yes … and if you were thinking that, then you’re missing the point – that’s sloth – that’s exactly the type of life I don’t desire because it starts me down a path that’s all too familiar and undesirable to me.
I painstakingly removed all the rotting bits from the fresh bits even though it took time to do it. This is the same approach I take in business and in trading – I remove as much risk and liabilities as I can before I consider taking the next step in my analysis for my trades or business. I never rush the process and will pay special attention to every detail before making the next move. Likewise, I don’t want my family eating rotting greens so I will take the effort to remove that risk.
Then I had to boil up the pasta, two hard boiled eggs, slice up the sausages and braise them along with the pasta, slice up the tomatoes, shiitakes and onions and start laying up the salad. The greens, shiitake and onions were mixed one layer at a time, each time adding olive oil, my own blend of herbs and peppers, a sprinkling of salt and garlic power, then I lay over the next layer of greens and repeat the process for at least four layers. This way, the flavours are properly and evenly blended with the greens when I toss them.
Next, the cooled pasta is laid down like a bed on the top of the greens and the sausage slices (also cooled) on top of the pasta. Around the edge of the bowl go the tomato slices and to top it all off, the hard boiled eggs are sliced and take their pride of place above the whole heap. Finally, one last sprinkling of salt, herbs and parsley flakes.

Wouldn’t it have been easier to just toss everything into a bowl and mix it all up? After all, we’re going to gobble it all down and it won’t make a difference in our bellies, right?
Yes … and if you were thinking that, then you’re still missing the point – that’s gluttony – that’s exactly the type of habit I despise because it pays no attention to detail, its slovenly and smacks of ill discipline.
Although I never attended cooking school, I am a graduate of Taste & Smell from the University of Culinary Trials & Errors. I have studied my craft and applied my methods with almost surgical precision. I pay attention to detail and am constantly looking for ways to improve the style. I am more interested in the process than the final result just like I am more intrigued by the journey than the destination. This way, I get to enjoy every bit of the entire experience and not just savour the end result.
I took this same approach when I decided to take trading seriously. I studied the craft and practiced painstakingly to improve my style. I broadened my knowledge of the business by learning economics, risk management, history, monetary policy, politics and psychology. I applied through trial and error everything I learnt. Like cooking, sometimes things didn’t work out so you start over with a new plan. With no one to guide me, the market became my test examiner while my wit became my teacher.
Wouldn’t it have been easier to just get some financial expert to tell me what to buy? Then if I lose, I can blame him instead?
Yes … and if you were thinking that, then you’re still missing the point – that’s pride – that’s exactly the kind of attitude dreamers have. They want to get rich quick without any effort and yet hold someone else responsible. Regardless of who is irresponsible, the bottom line is you are going to lose your money and you’ll be too proud to admit that you were too cowardly to pull the trigger yourself.
In my younger years, I used to rush to get to the final product. (Maybe that’s why I never finished what I started.) I was impatient, stubborn and proud. As a student, I didn’t care much about the learning process as long as I knew I could get my answers right. (Maybe that’s why I flunked out.) As a Film Producer, I didn’t care much about the process and got others to take care of the processes for me as long as my end product was approved. (Maybe that’s why my productions had low profit margins.) During my media days, I hired people to manage the process so that I wouldn’t have to. (That’s why I lost everything.)
But all that changed when I was hit with bankruptcy. As a result of not knowing the process behind running a business, I could not account for why I had failed so spectacularly. I couldn’t hold anyone responsible for my company’s collapse and I certainly could not blame anyone for my stupidity and ignorance in financial management. I had only realised my errors when I studied the process that led to my downfall, after the fact. It then became clear to me why I had failed so many times in the past without realising that I was repeating and compounding the same mistakes with each episode.
This totally turned me around and gave me a greater appreciation for studying the process, planning the process, working the process, improving the process and learning from the process. I began to enjoy the journey more than the destination. I fell in love with the concept of working it instead of instant gratification. I realised that things last longer if the process is well thought out and executed with passion.
I learnt that a really good bowl of salad is one made with love, patience, passion and from painstaking attention to detail.

I finally discovered the secret to long-lasting and truly gratifying success – its not the end product but the process that makes success.
Success belongs to those who
work at it the hardest and
believe in it the longest.
This is the same approach to which I raised my kids. Nothing could be done in haste. It was never going to be a one-time lesson for all time. The lessons had to be taught one painstaking event at a time. I gave my kids my undivided attention and made sure they were loved every bit of the way. I made them my best friends when they became teens so that I would be theirs. This made me the first and last person they would go to if ever they needed a friend to lend them a ear or simply a shoulder to lean on. I changed my ways so that my kids would have a good role model to mirror and a dependable friend they could trust.
I still continue this painstaking task today knowing that there is no instant gratification in raising my family. There will be more lessons between now and when they become parents themselves. And I will still be guiding them on how to be good parents when the time comes. There will be no expectations from me when they finally come into their own. I will die knowing I did my best for them because this is what I lived for.

And it was all because of a simple bowl of salad that took me one hour to prepare for my family.
~~~~~~~~~~~~~~~~~~~~~~~~~~~~
Happy National Day
to all my Singaporean readers!